Keep control of your operations by
utilising our reporting options.

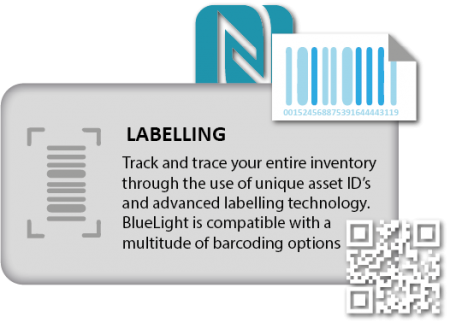
DATA
VISUALISATION
Book a Demo
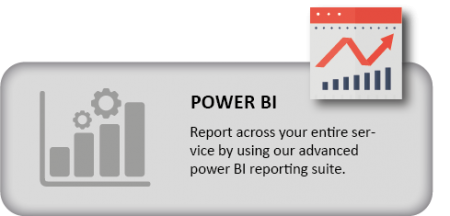
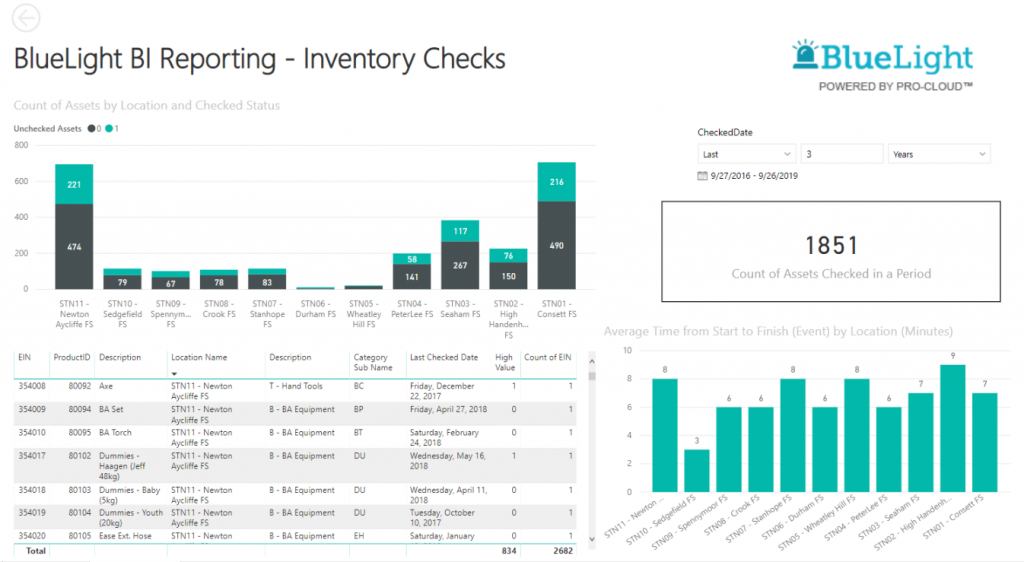
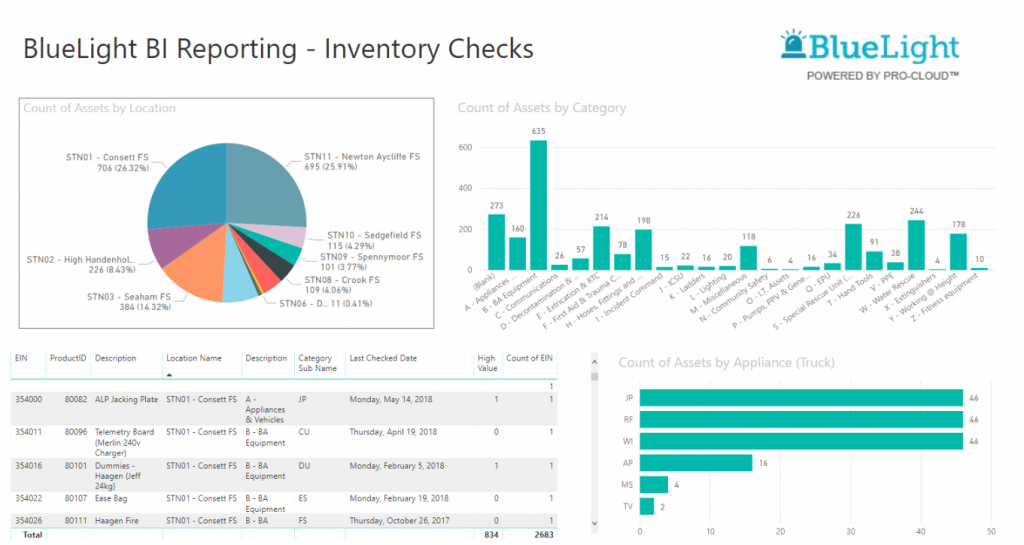
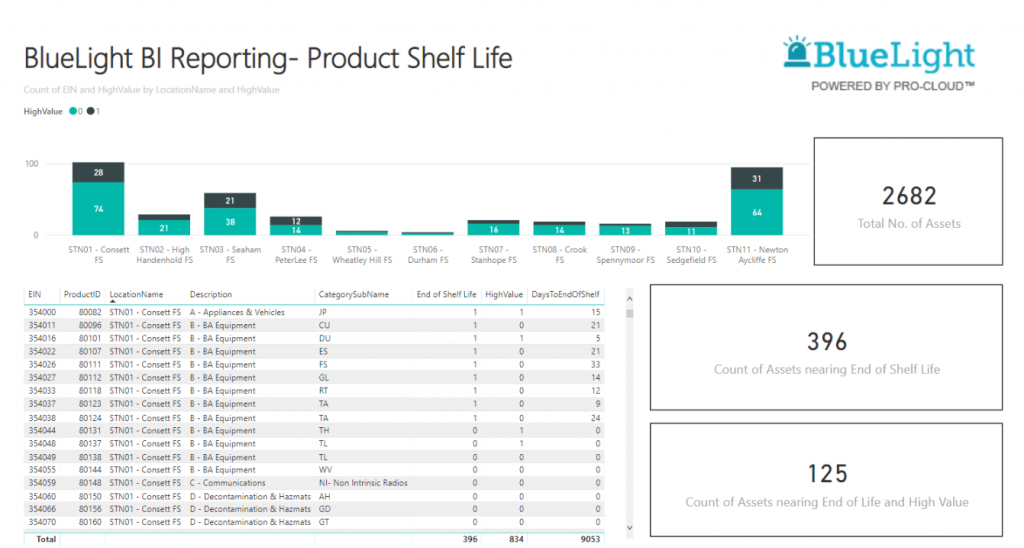
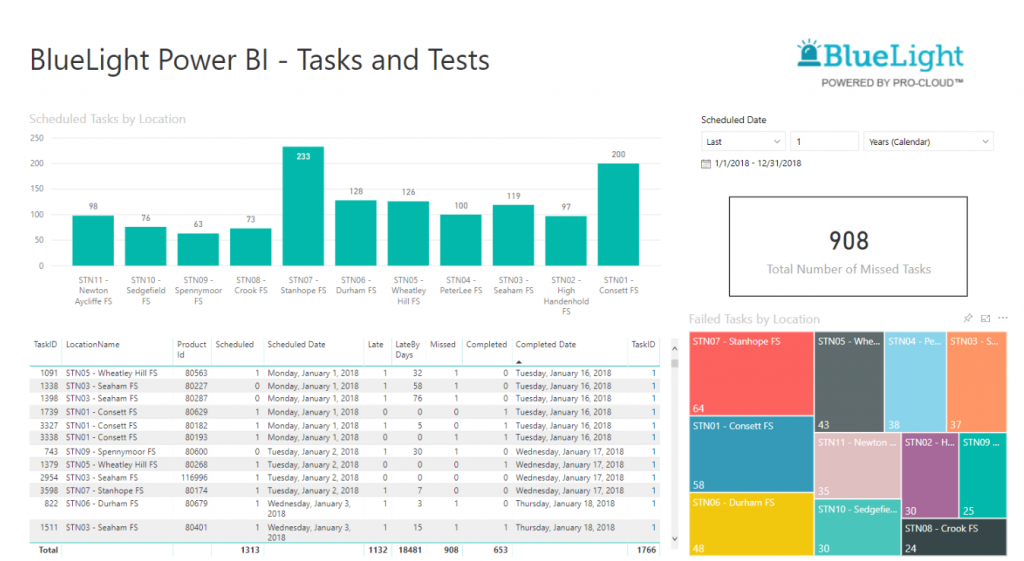
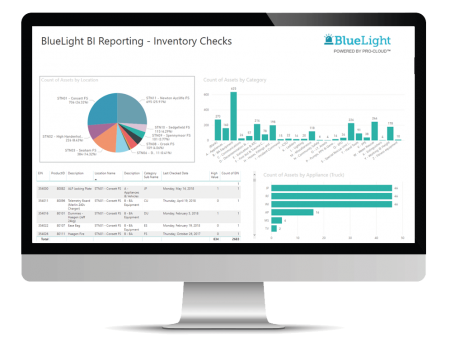
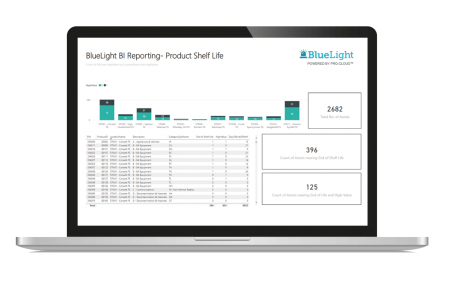
Advanced Microsoft business intelligence reporting
Reporting across your entire service from our Pro-Cloud BlueLight platform is simple with Microsoft Power Business Intelligence. With pre-built and custom-made reports you can easily visualise and compare regional and station KPI’s, asset failure rates, workshop repair times and asset repair costs on a single dashboard from the click of a button. Depending on specific requirements this data can then be exported to PDF, Word, Excel or. CSV format.
Keep workforce and asset performance high
Ensure your fire and rescue service is running as it should and spot trends at a glance. Act on your findings within moments and make sure past and present trends can be used for in-depth auditing purposes when applicable.
Benefit from...
Immediate staff management, incorporating if key performance indicators are being met by individuals and teams
Easy station activity comparison
Export data in a variety of formats
Analyse trends and use data to make better procurement decisions across the fire & rescue service
Simple to use, allowing all reports to be made and customised in-house without external support